A/B Testing for B2B Websites (The Practical Guide)
A/B testing is the practice we use of showing two versions of a web page to different visitors and measuring which one performs better against a defined goal. It is the simplest form of experimentation and optimisation, and in B2B, where a single converted lead can be worth tens of thousands of dollars, it is one of the highest return on investment activities a business can undertake.
Yet, most business to business type companies do not test. They redesign based on opinions, launch based on colleagues subjective opinions, and optimise based on gut feelings.
Consider this the antidote. A practical guide to running A/B tests on your B2B website, from forming the hypothesis to interpreting the results without fooling yourself.
At Yah Digital, testing is foundational to our philosophy. We explored the mindset in data over ego: rapid prototyping and design insights. This article gives you the insight into the execution.

Why A/B testing matters more in B2B (Example)
In B2C (Business to Customer) ecommerce, the average order value might be $50-$200. A 10% improvement in conversion rate is welcome but modest in absolute terms.
In business to business however, the calculations are very different. Let’s just say:
- Average customer lifetime value: $25,000-$500,000+
- Monthly website visitors: Often 5,000-50,000 (not millions)
- Conversion events: Lead form submissions, demo requests, consultation bookings
A 10% improvement in conversion rate for a business to business company who generates 100 leads per month from its website, means thats around 10 additional leads. As an example imagine a $50,000 LTV per customer, that is $500,000 in pipeline value per month ($6 million annually) and this from a testing regiment that costs a fractions of that to run.
The higher the customer lifetime value, the more each slight increase in conversion is worth, and the more A/B testing pays for itself.
The hypothesis-driven approach
The most common A/B testing mistake is testing without a hypothesis. Big mistake. Randomly changing button colours, swapping images, or rewriting headlines without a reason is not testing. It is guessing with a few extra steps.
Forming a testable hypothesis
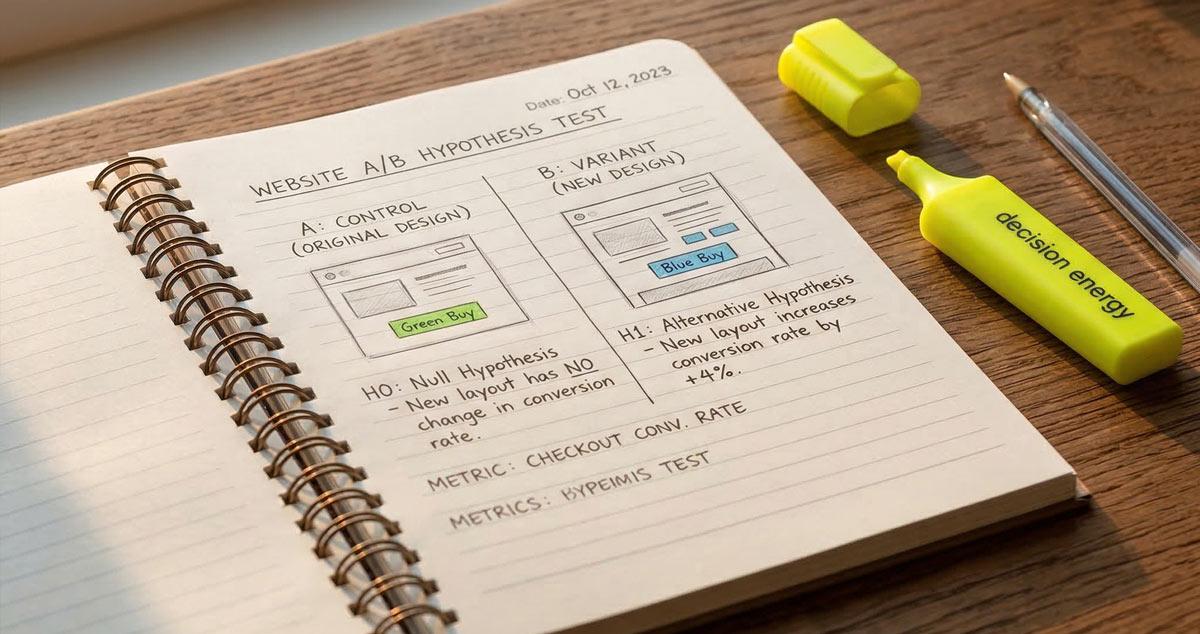
For us a proper A/B testing hypothesis follows this type of structure:
If we [change], then [metric] will [improve/decline] because [reason based on data or user insight].
Some examples:
- If we move the lead form above the fold on the Home page, then form submissions will increase because our heat-map data shows that 60% of visitors do not scroll past the midpoint. Or;
- If we replace the generic stock photo with a video walkthrough of our processes, then time on page will increase because session recordings show visitors are currently bouncing within 8 seconds of arrival. Or;
- If we reduce the form from 7 fields in use to 4, then the completion rate will increase because our analytics show us that theres a 45% abandonment rate at field 5.
Notice how each hypothesis is grounded in some form of underpinning data. This can either be heat-maps, session recordings or analytics. The data tells you where the friction in your website exists. The hypothesis processes and hyper specific changes to address that friction. The test validates or invalidates the hypothesis.
The Bayesian mindset
Traditional statistical testing method (frequentist) asks: What is the probability of seeing these results if there is no real difference?
The Bayesian inference asks: Given these are the results, what is the probability that version B is better than version A?
For B2B websites with lower traffic volumes, Bayesian methods are often more practical because they handle smaller sample sizes more gracefully and provide probability estimates that are easier to interpret and action upon.
You do not need a statistics degree to apply this. Modern testing platforms handle the calculations. What you need is the discipline to form a hypothesis before testing and the patience to let the test reach completion before acting.
What to test on a B2B website
Not everything is worth testing. And the worst you can do is test everything at once. Focus your testing programme on the elements with the highest potential impact on your conversions.
High-impact elements (test these first)
- Headlines and value propositions
The heading on your landing page is the first thing visitors process. A headline that clearly states the outcome, brand story and what your customers care about will outperform a headline that describes what you do. - Call-to-action copy and placement
“Get a Free Quote” versus “Get Your Free Website Health Check” versus “See What’s Possible.” The specificity and perceived value of the CTA directly influence click-through rates. Test copy, button colour, placement (above fold vs inline vs sticky), and the number of CTAs per page. From some of our client tests the results of this little copy test in CTAs can be exponential, especially in volume. - Lead form length and design
Every additional form field reduces completion rate. But in business to business, qualifying your users matter. You need enough information to determine if the lead is worth pursuing for your business. Test the trade-off: fewer fields (higher volume, lower quality) versus more fields (lower volume, higher quality). - Social proof positioning
Testimonials, client logos, case study snippets, and data points like 15+ years in business build trust. Test their placements in places like; above the fold, next to the CTA, in a dedicated section, or embedded within your body copy.
Medium-impact elements
- Page layout and content hierarchy
Does the long-form content approach outperform the short-form content approach? Are our users getting bored of the ready by paragraph 12? Are they being informed enough to make a decision? In B2B, longer pages often convert better because the audience needs more information to make a high-stakes decision. But test it. - Navigation structure
Simplifying navigation can reduce cognitive load and increase the probability that visitors reach the page you are aiming to converts from. Test streamlined navigation against your current structure. There is a reason why squeeze pages remove the navigation to squeeze. Keep it relevant to your audience.
Low-impact (avoid wasting test cycles)
Button colour in isolation, minor font changes, footer layout, and decorative elements rarely produce statistically significant results. These things are subjective but surprisingly the most interesting conversational items at the board room table. Save your testing bandwidth for the elements that actually move the needle.

Setting up your first A/B test
Choosing a testing platform
Google Optimize was sunset in September 2023. It was solid. But this landscape has changed over the last few years. The platforms have lasted the shifts, are the ones we use. Below are some from the current landscape for B2B-appropriate testing that we’ve used and still use:
- VWO (Visual Website Optimizer) -established platform with visual editor which makes on page editing a breeze and robust analytics. Start your testing underpinned by the hypothesis.
- AB Tasty - strong for mid-market B2B with personalisation capabilities. Plenty of experiment options with build in editor for easy small incremental splits.
- Hotjar (Contentsquare) - Our go-to for heat mapping and experience journey tracking. Recorded sessions allow you to specifically identify problem points needed to address.
For most B2B sites, VWO or AB Tasty provide the right balance of ease-of-use and statistics. Both enabling you to formulate and execute upon hypothesis. However for realtime data, Hotjar (Contentsquare) ticks the boxes for analysis to confirm hypothesis.
Sample size calculations
This is where B2B testing differs most from B2C. You probably do not have millions of monthly visitors. A B2B site with 10,000 monthly visitors and a 2% conversion rate generates approximately 200 conversions per month – 100 per variation in a standard A/B test.
To detect a 20% relative improvement (conversion rate moving from 2.0% to 2.4%) with 95% statistical significance and 80% statistical power, you need approximately 9,500 visitors per variation. At 10,000 monthly visitors, that is roughly a two-month test.
Implication: B2B tests run longer than B2C tests. Accept this. A two-month test that produces a valid result is infinitely more valuable than a two-week test that produces noise.
Test duration rules
- Minimum runtime: Two full business weeks (to capture weekday/weekend variation)
- Recommended: Run until your platform reports statistical significance at 95% confidence, or until a predetermined maximum duration (typically 8-12 weeks for B2B)
- Never stop a test early because one variant “looks like it’s winning.” Early results are noisy. The statistics need time to stabilise.
Interpreting results without fooling yourself
Statistical significance vs practical significance
Statistical significance tells you whether the observed difference is likely real (not just noise). Practical significance tells you whether the difference is large enough to matter.
A test might show a statistically significant 0.1% improvement in conversion rate. That is real, but for a B2B site generating 200 leads per month, it represents 0.2 additional leads. Not worth the implementation effort.
Conversely, a test might show a 15% improvement that is not yet statistically significant because the sample size is too small. That does not mean the improvement is not real – it means you need more data before you can be confident.
Common pitfalls
Peeking. Checking results daily and making decisions based on early data. Most A/B testing errors stem from peeking. Set a review schedule (weekly or bi-weekly) and commit to running the full duration.
Selection bias. Running a test during an atypical period (product launch, seasonal peak, industry conference) and applying the results to normal conditions. Ensure your test period is representative.
Multiple testing. Running many tests simultaneously on the same pages without accounting for interaction effects. Sequential testing with a clear priority queue is more reliable for most B2B sites.
Survivorship bias. Only analysing tests that “worked” and ignoring those that showed no difference. Null results are valid and valuable – they tell you where not to invest further effort.
When “no difference” is a valid result
A well-run test that shows no statistically significant difference between variants is not a failure. It is a data point that tells you this particular element, at this particular variation, does not meaningfully influence your conversion rate.
This is valuable because it prevents you from investing development resources into a change that would not have moved the needle. Move to the next hypothesis and test something else.
Multivariate testing for complex pages
Standard A/B testing compares two versions of a single variable. Multivariate testing (MVT) tests multiple variables simultaneously – headline, CTA, image, and layout – in all possible combinations.
When to use MVT
MVT is powerful when you suspect that interactions between elements matter more than individual elements. For example, a formal headline might perform better with a blue CTA button, while a casual headline might perform better with an orange one. MVT captures these interactions.
The traffic reality
The catch: MVT requires significantly more traffic than A/B testing because each combination needs sufficient visitors to reach significance. A test with 3 headlines, 2 CTAs, and 2 images generates 12 combinations. At 1,000 visitors per combination, you need 12,000 visitors – potentially months of traffic for a B2B site.
For most B2B websites, sequential A/B tests are more practical than MVT. Test the highest-impact variable first, implement the winner, then test the next variable.
Building a testing culture
The most valuable outcome of A/B testing is not any single result. It is the organisational shift from opinion-based decisions to evidence-based decisions.
The 15-minute tiebreaker rule
When stakeholders disagree on a design or copy choice and the debate exceeds 15 minutes, the debate ends and the decision defaults to a live test. This rule, which we described in our data over ego article, removes ego from the process and replaces it with accountability to the data.
Connecting testing to brand strategy
A/B testing is not separate from brand strategy – it is the mechanism for validating brand decisions in the market. The data matching methodology we use in brand strategy sessions produces hypotheses about what messaging resonates. A/B testing validates those hypotheses with real user behaviour.
Strategy informs the hypothesis. Testing validates the strategy. The loop is continuous.
Get your conversion baseline
You cannot optimise what you do not measure. Before running your first test, you need a clear understanding of your current performance: conversion rates by page, by traffic source, and by device. Where are users dropping off? Where are they engaging?
Get your free website health check and we will give you the performance baseline your testing programme needs to start.
Disclaimer
The information provided in this blog is done on a best effort basis. No warranty and or guarantees are given or implied.